
Monitoring lives apart
Health and reachability sit in one console, disconnected from topology and change.
No suggestions match. Press Enter to search the whole site.

Discover devices, watch them continuously, map how they connect, and alert your team the moment something degrades, from one self-hosted console with no agents on devices.
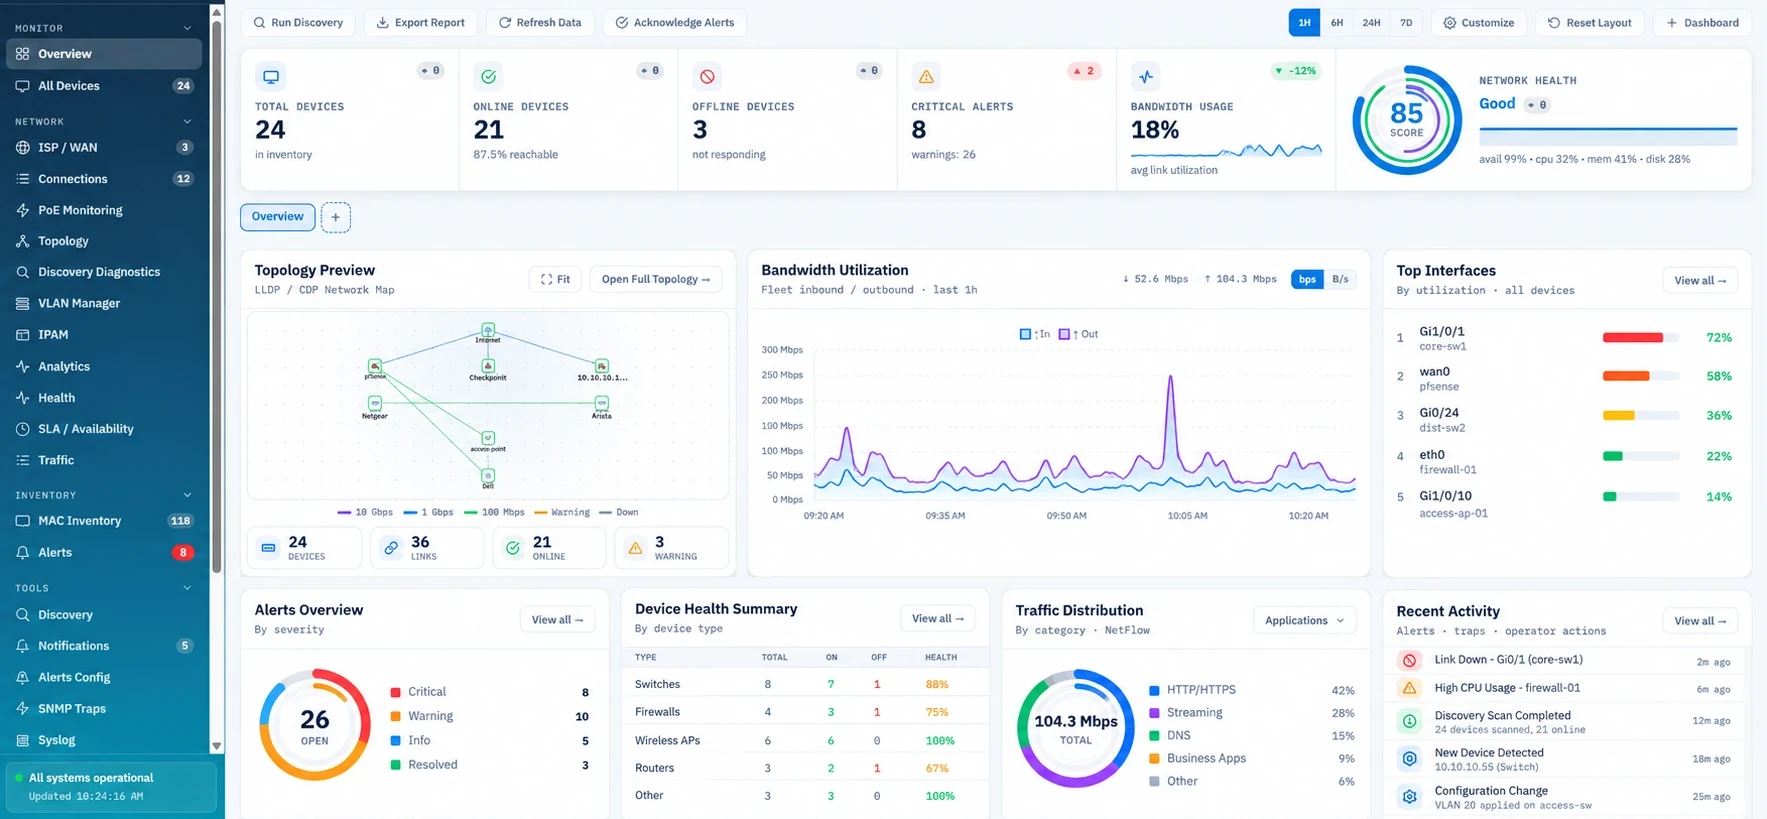 Sample data
When the estate is split across monitoring, topology, traffic, alerts and configuration, the answer is spread everywhere, and nights are spent stitching tools together instead of restoring service.
Health and reachability sit in one console, disconnected from topology and change.
How devices connect is drawn in another tool, if it is drawn at all.
A threshold fires without a clear path to the port, VLAN, neighbour or circuit.
Four questions cover most of network operations. Rhinexa NMS answers all four from the same console, against the same live inventory.
Scan an address, a range or a subnet. Live hosts are found, named, classified and kept in an inventory that updates itself.
Reachability, CPU, memory, storage, temperature, response time and interface state, polled on a schedule and stored as history.
Per-interface throughput, errors and discards, WAN utilisation and flow analytics that show which conversations consume capacity.
Threshold and reachability alerts with acknowledge and resolve workflow, plus syslog, SNMP traps and an audit trail of operator actions.
The same six steps every time an incident happens, without handing you off to another tool.
Sweep a subnet or add a device. Hosts are found, classified and added to inventory.
Reachability, interfaces, counters and system health are polled and stored as history.
Thresholds and reachability rules raise a deduplicated alert and notify your team.
Drill from the alert to the device, interfaces, VLAN, neighbours and traffic.
Acknowledge, act with previewed changes where supported, then resolve the incident.
Availability, bandwidth, alert and inventory reports on demand or on a schedule.
Every capability below ships in the current console.
Also included
The same platform covers a single segment or a distributed estate.
One console for status, topology, traffic and alerts across the estate.
Infrastructure monitoring with role-based access and an audit trail.
Device, interface, topology and traffic visibility across switching, routing and server connectivity.
Connectivity and device monitoring across floors and buildings, including VLAN and PoE views.
Per-link utilisation, latency, jitter, loss and outage history against each circuit.
No mandatory cloud in the monitoring path; suitable for air-gapped environments.
Collection, storage and the dashboard run on hardware you own, inside your own network boundary.
Administrator, read and write, and read-only roles; writes and administrative actions gated centrally.
Protected credentials, signed sessions and rate-limited login with lockout after failures.
SNMP communities and device secrets encrypted at rest and never returned to the browser.
Logins, configuration actions and access denials recorded alongside syslog and traps.
Supported VLAN and port edits show the exact commands before apply, with rollback and an audit entry.
Suitable for air-gapped and controlled estates.
A guided walkthrough of discovery, monitoring, topology, traffic and alerts, or an evaluation on your own infrastructure.
Request a Rhinexa NMS evaluationOur Infrastructure Security practice baselines, hardens and assures the platforms Rhinexa NMS watches.
Explore the practice